 GDPR
GDPR
Carbon data · Reduction · Assurance
See your emissions. Plan reductions. Show your progress.
Manage facility data, emissions calculations and targets in one place. Know what to do next.
Collect evidence with your team and keep it ready for independent review.
1,250,000t CO₂e
Corporate carbon
3 facilitiesYour emissions inventory, in one view.
Total emissions12,475t CO₂e
vs. previous year−12.8%Annual change
Data completeness94%282 / 300 records
Emissions trendt CO₂e
JanMarMayJulSepDec
Inventory by scopet CO₂e
Scope 12,99424%
Scope 24,86539%
Scope 34,61637%
Reduction actions
2026 planClear owners. Measurable progress.
Active actions8Across 3 facilities
Reduction potential1,840t CO₂e / year
Completed3 / 8Actions
Action planProgress
Rooftop solar installationEnergy team
In progressFleet electrificationOperations
In progressSupplier data collectionProcurement
CompletedCompliance & assurance
3 frameworksTrack controls, evidence and review status.
Completed controls46Across frameworks
Evidence files32Linked to controls
Pending review4Evidence records
Readiness overviewStatus
GHG Protocol18 / 24 controls
PreparingISO 14064-116 / 20 controls
In reviewISO 5000112 / 12 controls
CompletedSample data · Explore the workspace from the menu.


GHG ProtocolISO 14064-1ISO 50001ESRS E1–E5SBTiIFRS S2CDPPACT V3GHG ProtocolISO 14064-1ISO 50001ESRS E1–E5SBTiIFRS S2CDPPACT V3
Privacy & security by design
Guard every climate decision with trusted data.
Operational data, evidence and climate decisions deserve the same rigor. ErgOps is designed around accountable access, privacy-aware handling and auditable workflows.
GDPR ISO 27001
 SOC 2
SOC 2 GHG Protocol
 ISO 14064-1
 ISO 50001
 ISO 14067
 ISO 14068
 ISO 14083
 ISO 14046
 ESRS E1–E5
 SBTi Net-Zero
 IFRS S2
 PACT V3
 GRI
GRI CDP
CDPOne connected workflow
From fragmented data to defensible decisions
Each step stays connected to the activity records, calculations and people behind it.
01 / CollectConnected data
Facilities, meters, imports and suppliers in a governed data hub.
02 / MeasureTraceable carbon
GHG inventory, factors, confidence and calculation explanations.
03 / PlanActionable pathways
Targets, scenarios, budgets and decarbonization initiatives.
04 / AssureReviewable evidence
Shared controls, assigned work and independent auditor decisions.
Connected sustainability operations
From facility data to defensible progress
ErgOps keeps source records, calculations, action ownership, evidence and reviews connected—so each report can be traced back to the operation behind it.
One operating model
Every workflow stays in context.
Move from measurements to actions and report-ready decisions without losing the source or the person responsible.
Value-chain ready
Built around real operational contexts.
Organize facilities, suppliers and activity data in the context of the sectors you work across.
ManufacturingLogisticsFood & beverageRetailConstructionTechnologyManufacturingLogisticsFood & beverageRetailConstructionTechnology
AutomotiveChemicalsWarehousingPackagingProfessional servicesE-commerceAutomotiveChemicalsWarehousingPackagingProfessional servicesE-commerce
Evidence that travels
Walk into every review with context.
Link records to checks, preserve reviewer decisions and carry the evidence trail into reporting.
Integrations
Bring your data into a connected workspace.
Connect operational data through file imports, APIs and event flows. Build on the systems your team already uses.
Available data connections
Choose the method that fits your workflowExcel / CSV
Structured activity and procurement data
REST API
Connect your software with ErgOps Embedded
Webhooks
Receive events in your own workflows
SAP
Procurement data through file imports
Logo
Import procurement records
Mikro
Map procurement and supplier data
Netsis
Bring ERP exports into the data hub
Integration roadmap
Planned connectionsMicrosoft Dynamics 365
Business application connections
Oracle
Enterprise resource planning data
IoT / Smart meters
Automated facility measurements
How teams work
Designed for continuous improvement
01
Connect & validate
Import operational data, map it to facilities and review quality before calculating.
02
Measure & prioritize
Run GHG analysis, compare pathways and assign reduction actions to teams.
03
Evidence & review
Attach supporting records to controls and track independent auditor feedback.
Readiness reflects available controls and evidence; it never implies certification or legal compliance.
Compliance & Assurance
Prepare step by step for regulatory compliance.
Use our modular structure to quickly identify and track your gaps.
Carbon accounting
GHG Protocol
Organizational inventory boundaries, Scope 1–3 data and calculation evidence.
Preparing01 / 03
- Define controls
- Prepare evidence
- Complete readiness
Climate disclosure
ESRS E1
Climate policies, transition plans, metrics and supporting disclosures.
Preparing01 / 03
- Define controls
- Prepare evidence
- Complete readiness
GHG inventory
ISO 14064-1
Inventory design, quantification, reporting and evidence traceability.
Preparing01 / 03
- Define controls
- Prepare evidence
- Complete readiness
Energy management
ISO 50001
Energy baseline, performance indicators and improvement actions.
Preparing01 / 03
- Define controls
- Prepare evidence
- Complete readiness
ErgOps was selected among hundreds of entrepreneurs at the TechAnkara Startup Competition — Top 100 finalist.
ErgOps Academy
Sustainability Capability
Assign training to your employees and track their development in sustainability.
Personal learning pathFrom data to decision-ready action
Short, structured modules for practitioners who want to build a credible foundation before managing a sustainability workspace.
- 01Carbon Accounting FundamentalsBoundaries, activity data and traceable calculations55 min
- 02GHG Protocol FundamentalsCorporate inventory principles and responsible reporting80 min
- 03Scope 1 & Scope 2 FundamentalsDirect and purchased-energy emission sources70 min
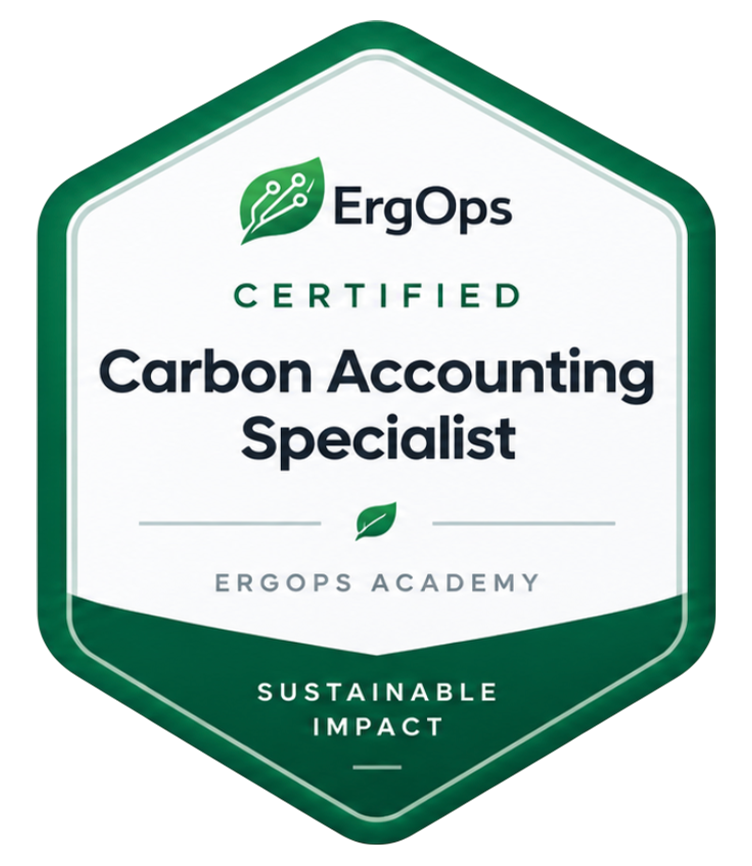
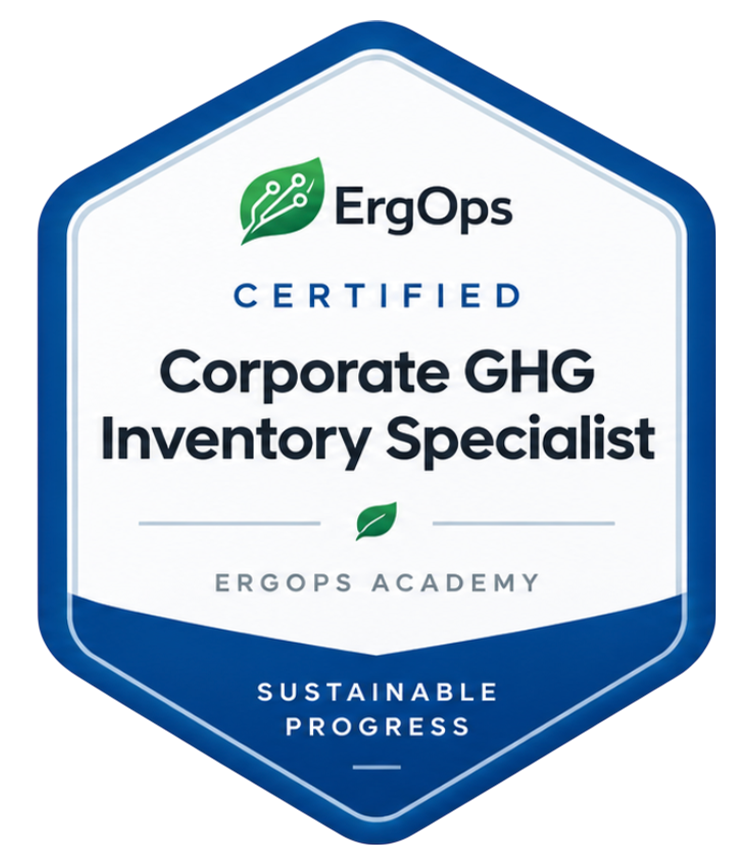
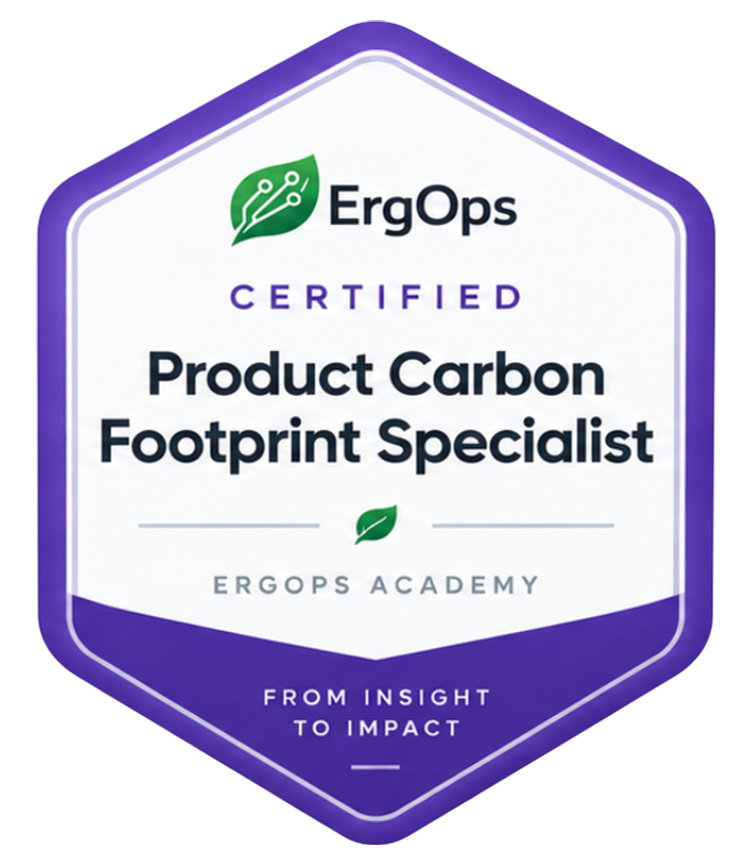
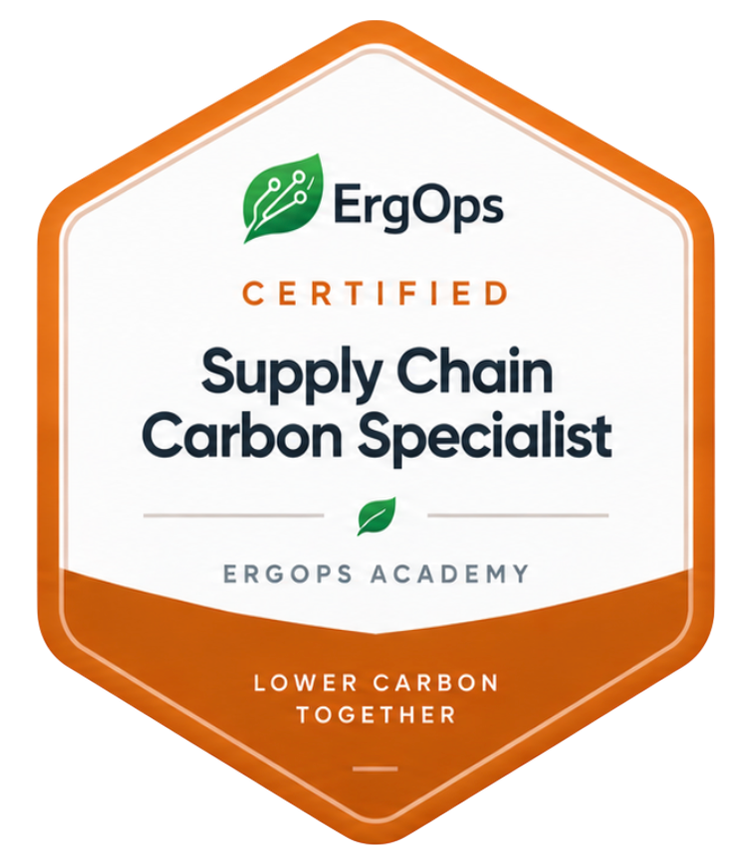
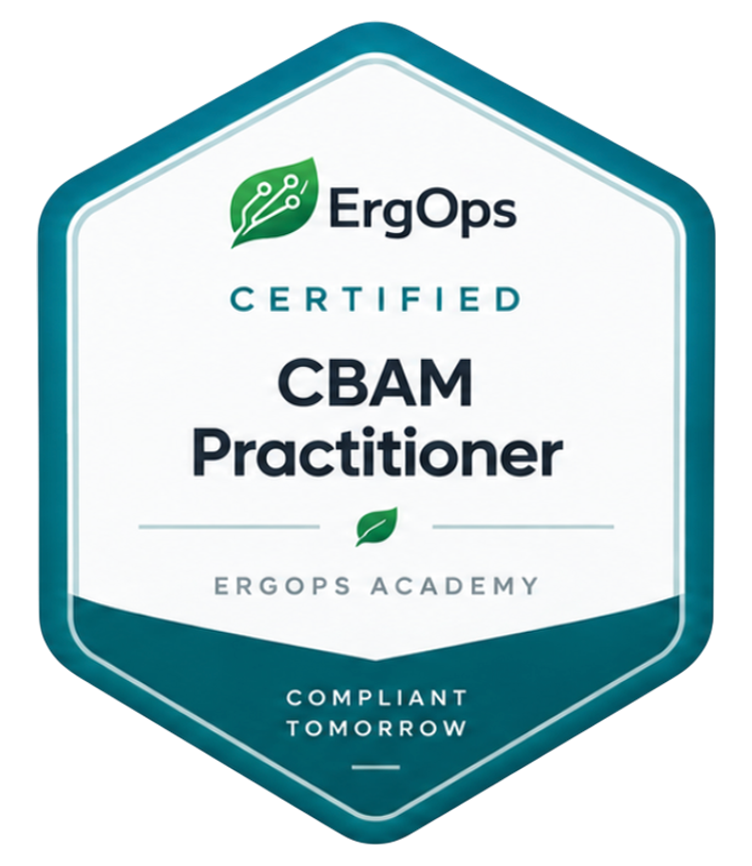
ErgOps Academy credentials
Explore all →Professional credentials for measurable expertise
FAQ
Frequently Asked Questions
ErgOps connects operational data collection, greenhouse gas inventories, reduction targets, compliance readiness and reporting in a shared workspace. Training assignments also support the development of employee sustainability capabilities.
Start with your organization and facility structure, reporting period, and energy, fuel or activity records. Add supplier, procurement and product data as needed. The data hub helps you follow up on missing records and data quality.
Direct emissions, purchased energy and value-chain activities are organized by scope. Calculations are linked to activity records and emission factors so teams can track inventory boundaries, data sources and results together.
Procurement data from SAP, Logo, Mikro and Netsis can be imported through files. Excel and CSV support structured data imports. API and webhook requirements are addressed through ErgOps Embedded; planned direct connections are identified separately on the integration roadmap.
Facilities and assets can be organized within an organizational hierarchy. Team members track tasks, data records and evidence according to their permissions, enabling central sustainability teams and operations teams to work through a shared process.
Workspace access is managed through organization membership and assigned permissions. Data entry, reporting, administration and evidence review are subject to role and permission controls. Your access and data governance requirements can be assessed before implementation.
Track controls, owners, evidence and gaps for the standards and reporting frameworks your organization works with. The modular structure helps manage readiness work across multiple frameworks in a shared process.
Readiness reflects completed platform controls and available evidence. It does not replace official certification, independent verification or a legal compliance decision. Those decisions belong to the relevant authorized bodies and independent assessment processes.
Teams assign owners to controls and upload supporting documents. Authorized reviewers assess evidence and record comments and decisions. Missing records and requests for further preparation are followed up through the same workflow.
ErgOps Academy lets you assign employee training, set due dates and track learning progress. Learning modules and completion records support organizational capability development.
The reporting workflow connects activity records, calculations and supporting evidence. Teams can manage reporting periods, source records and outputs together to trace the basis of their results.
During the demo, we review your facility structure, data sources, priorities and team needs. Modules, data transfer methods and initial scope are defined around those requirements. Use the contact form to request a demo.
Make every sustainability decision traceable
Connect your facilities, emissions, targets, framework checks and evidence in one workspace built for accountable progress.
In the first meeting, we map your data sources, priority goals and review workflow.